Recent Election Results – The Bar Graph
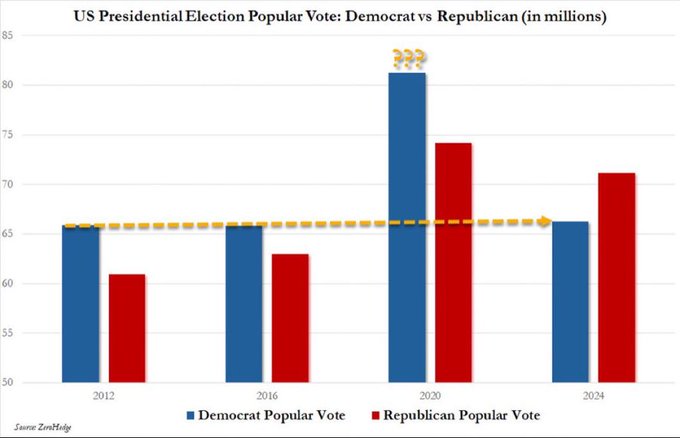
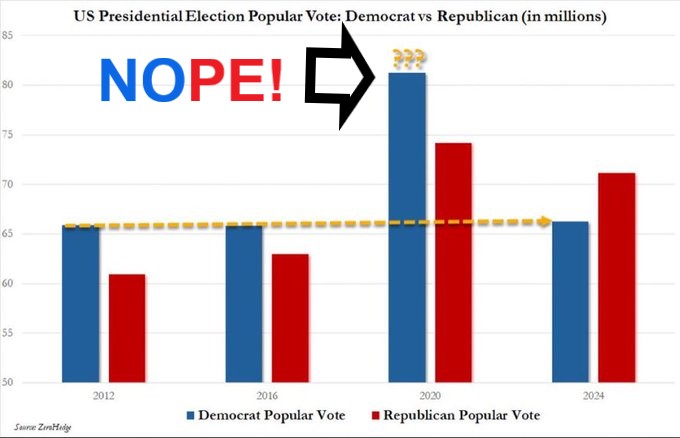
It has been said that a picture is worth a thousand words. What does this picture tell you about Recent Election Results for #POTUS? Nope2020 has maintained this position since the 2020 Election Cycle, there were more votes than voters. Why is there such a spike in 2020? Why didn’t we see it again 4 years later? So many Questions!

Questions
Do you see it? It tells me something was extremely abnormal, seemingly #Artificial, with the Recent Election Results in 2020. Can you explain it? Consider not much has changed for the methods of voting. Did Lock Downs cause it? It should be lower, not significantly higher. Where did almost 20 million votes/voters go in 2024, just 4 years later, where did those votes go? Especially with “Democracy On The Ballot!”, wouldn’t you think the turn out would be the same or greater in 2024 than in 2020? What could have caused such an anomaly? The spike seems suspect in the Blue Column to me, while with Trump’s popularity his column stayed relatively the same.
Recent Election Results Answers
I know this is 4 years ago and we now have a new incoming Administration. Should there be some sort of real “Investigation” into what happened to cause this? It could not be duplicated a second time, why? With all the rhetoric, Trials, Convictions, Raids, etc. discussed daily in the #MSM there was no #BlueWave! You can see it in the Recent Election Results! Did #TheyRiggedIt, What do you think? Should there be an Investigation? Is Retribution in the form of Prosecutions a bad idea? Would the Charges include #Treason for the #Fraud committed upon #WeThePeople?
General Information
Please check our Latest Posts often for updates and new content!
This Website is part of the Nope2020.Org and PublicPlatformProject.Us group of websites.
